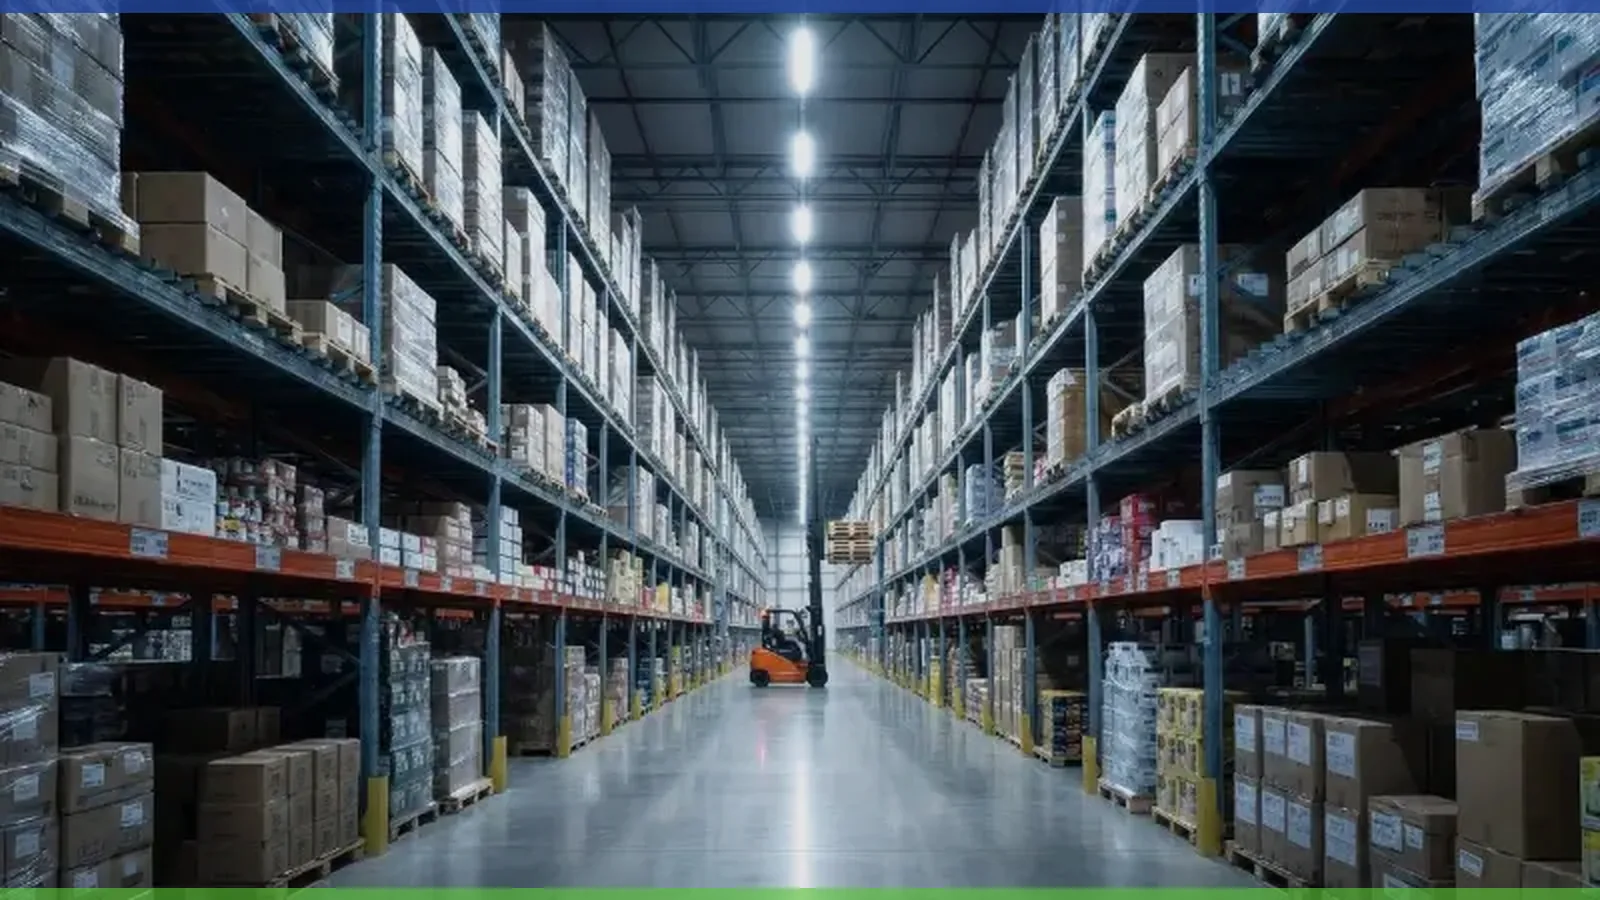
You’re specifying fixtures for a 10,000 m² warehouse. The supplier offers two options: a standard 130 lm/W fixture at a competitive price, and a premium 200 lm/W fixture that costs 25–40% more upfront. Your procurement team wants the cheaper option. Your engineering team wants the efficient one. Who is right?
The answer depends on more than just the unit price on a purchase order. High luminous efficacy — the measure of how effectively a fixture converts electrical watts into visible lumens — has cascading financial effects that extend far beyond the electricity bill. In this article, we break down the real cost-benefit of specifying 200 lm/W fixtures for industrial and commercial applications, including where the math works in your favor and where diminishing returns set in.
Key Takeaways
- A 200 lm/W fixture requires roughly 35% less wattage than a 130 lm/W fixture to deliver the same lumen output — translating directly into lower energy costs, reduced thermal load, and smaller electrical infrastructure requirements.
- For facilities operating 16+ hours per day, the energy savings from high-efficacy LEDs typically recoup the price premium within 12–24 months, with 10-year returns often exceeding 300%.
- Efficacy is not the only performance metric — buyers must evaluate CRI, thermal management, glare control, and driver quality alongside lm/W to avoid sacrificing light quality for efficiency numbers.
What Luminous Efficacy Actually Measures
The Core Formula
Luminous efficacy is defined as the ratio of luminous flux (measured in lumens) to electrical power consumed (measured in watts). Expressed as lumens per watt (lm/W), it tells you how much visible light a fixture generates for every watt of electricity it draws. A fixture rated at 200 lm/W produces 200 lumens of visible light for every watt consumed — roughly 54% more light per watt than a fixture rated at 130 lm/W.
This is not a theoretical abstraction. It is the single most important number for predicting a fixture’s impact on your energy bill, because it determines the wattage you need to achieve a given illuminance level on the working plane.
Chip-Level vs. Luminaire-Level Efficacy
A critical distinction that many procurement teams overlook: LED chip manufacturers often publish efficacy figures at the package level — the bare chip tested under ideal laboratory conditions (typically 25°C junction temperature, low drive current). The efficacy of the complete luminaire is always lower, because it accounts for losses in the driver, optics, thermal management system, and any diffusers or lenses. A chip rated at 220 lm/W might deliver 170–200 lm/W at the luminaire level, depending on the quality of the fixture design. Always compare luminaire-level efficacy confirmed by LM-79 photometric testing, not chip-level marketing numbers.
The Energy Savings Math: 130 lm/W vs. 200 lm/W
A Direct Comparison
Consider a practical scenario: a distribution center needs 30,000 lumens per fixture across 100 mounting points. Here is how the two efficacy tiers compare:
| Parameter | Standard (130 lm/W) | Premium (200 lm/W) |
|---|---|---|
| Required Wattage per Fixture | 231 W | 150 W |
| Total System Load (100 fixtures) | 23.1 kW | 15.0 kW |
| Annual Energy (16 hrs/day, 365 days) | 134,906 kWh | 87,600 kWh |
| Annual Energy Cost (@ $0.12/kWh) | $16,189 | $10,512 |
| Annual Savings | — | $5,677 |
| 10-Year Energy Savings (no rate increase) | — | $56,770 |
Assumptions: 30,000 lumens per fixture, 100 fixtures, 16 operating hours/day, 365 days/year, $0.12/kWh commercial electricity rate. Does not include demand charge reductions or HVAC savings.
That 35% wattage reduction generates nearly $5,700 in annual energy savings for a single 100-fixture installation. Over a typical 10-year LED lifespan, the cumulative savings approach $57,000 — before accounting for electricity rate increases, demand charge reductions, or HVAC benefits.
The Hidden Multiplier: HVAC Load Reduction
Every watt of lighting energy eventually converts to heat. In climate-controlled facilities — warehouses with cold chain requirements, food processing plants, or pharmaceutical cleanrooms — that heat must be removed by the cooling system. According to analysis of 500+ industrial retrofits, eliminating 100 kW of lighting load can reduce HVAC energy consumption by 30–35 kW, adding an additional $15,000–$25,000 in annual savings for year-round cooling facilities. The 8.1 kW difference between our 130 lm/W and 200 lm/W scenarios would translate to roughly 2.4–2.8 kW of HVAC savings — a modest but meaningful contribution to total cost of ownership.
ROI and Payback Analysis
When Does the Premium Pay for Itself?
Assume the 200 lm/W fixture costs $180 per unit and the 130 lm/W fixture costs $130 per unit — a $50 premium, or $5,000 for 100 fixtures. With $5,677 in annual energy savings alone, the simple payback period is approximately 10.6 months. Even with a more conservative 30% price premium ($4,000 total), you recover the investment within 8.5 months.
Data from real-world LED retrofits consistently shows that most commercial and industrial LED upgrades achieve full payback within 1.5 to 3 years, with 10-year returns frequently exceeding 300%. High-efficacy fixtures accelerate these timelines further because they compress the payback window while extending the savings runway.
Factors That Accelerate or Delay Payback
| Accelerators (Shorter Payback) | Decelerators (Longer Payback) |
|---|---|
| High operating hours (16–24 hrs/day) | Low operating hours (<8 hrs/day) |
| High electricity rates (>$0.15/kWh) | Low electricity rates (<$0.08/kWh) |
| Utility rebates (can offset 20–50% of cost) | No available incentive programs |
| Climate-controlled environments (HVAC multiplier) | Non-conditioned outdoor or open-air spaces |
| Demand charge structures that penalize peak load | Flat-rate energy billing |
| Replacing legacy HID (400W+ systems) | Upgrading from recent-generation LEDs (110+ lm/W) |
For cold storage facilities, 24/7 manufacturing plants, and parking structures — environments where Fanxstar’s weatherproof LED fixtures are most commonly deployed — the combination of long operating hours and climate-controlled conditions creates particularly strong economics for high-efficacy specification.
The Tradeoffs: What 200 lm/W Can Cost You Beyond Price
Color Rendering vs. Efficacy
There is a well-documented inverse relationship between luminous efficacy and color rendering quality. Achieving very high lm/W numbers typically requires optimizing the LED spectrum toward wavelengths where human vision is most sensitive (green-yellow), which can come at the expense of red color rendering. The lumen penalty for high CRI can range from 20 to 30 percent, depending on the degree of color enhancement required.
For industrial warehouses and parking structures where CRI 80 is perfectly acceptable, this tradeoff is minimal. But for food retail, healthcare environments, or quality inspection zones where accurate color rendering is essential, specifying a 200 lm/W fixture with CRI 70 would be a false economy. In our experience working with food processing and retail clients, we recommend balancing efficacy targets against the CRI requirements of the specific application — a 170 lm/W fixture at CRI 90+ often delivers more operational value than a 200 lm/W fixture at CRI 70.
Color Temperature and Efficacy
Cooler color temperatures (5000K and above) generally produce higher efficacy numbers than warm white (3000K). The U.S. Department of Energy found that among high-efficacy luminaires tested, dropping from 5000K to 3000K resulted in up to a 17% loss in efficacy. When comparing fixtures across suppliers, always confirm that efficacy figures are quoted at the same CCT.
Glare and Visual Comfort
The DOE’s evaluation of high-efficacy luminaires revealed a significant finding: the product rated highest by observers for visual comfort actually had the lowest tested efficacy among the group (136 lm/W). Many high-efficacy fixtures achieve their numbers by using exposed LED emitters without adequate optical control, which causes direct glare — a serious concern in working environments. Proper optical design (reflectors, diffusing lenses, anti-glare baffles) will reduce measured efficacy by several percent, but the improvement in visual comfort and worker productivity typically justifies the small efficiency cost.
Thermal Management at High Efficacy
Ironically, higher-efficacy LEDs generate less waste heat per lumen, which actually eases thermal management requirements. A 200 lm/W fixture converts a higher percentage of input energy into light, leaving less energy to dissipate as heat. This means lower junction temperatures, slower lumen depreciation, and longer effective lifespan — provided the fixture designer hasn’t used the reduced thermal budget as an excuse to cut corners on the heatsink. In cold storage environments operating at -40°C, this thermal advantage is compounded: lower waste heat means less interference with the ambient cooling system, and fixtures rated for extreme cold can operate closer to their peak efficiency in these conditions.
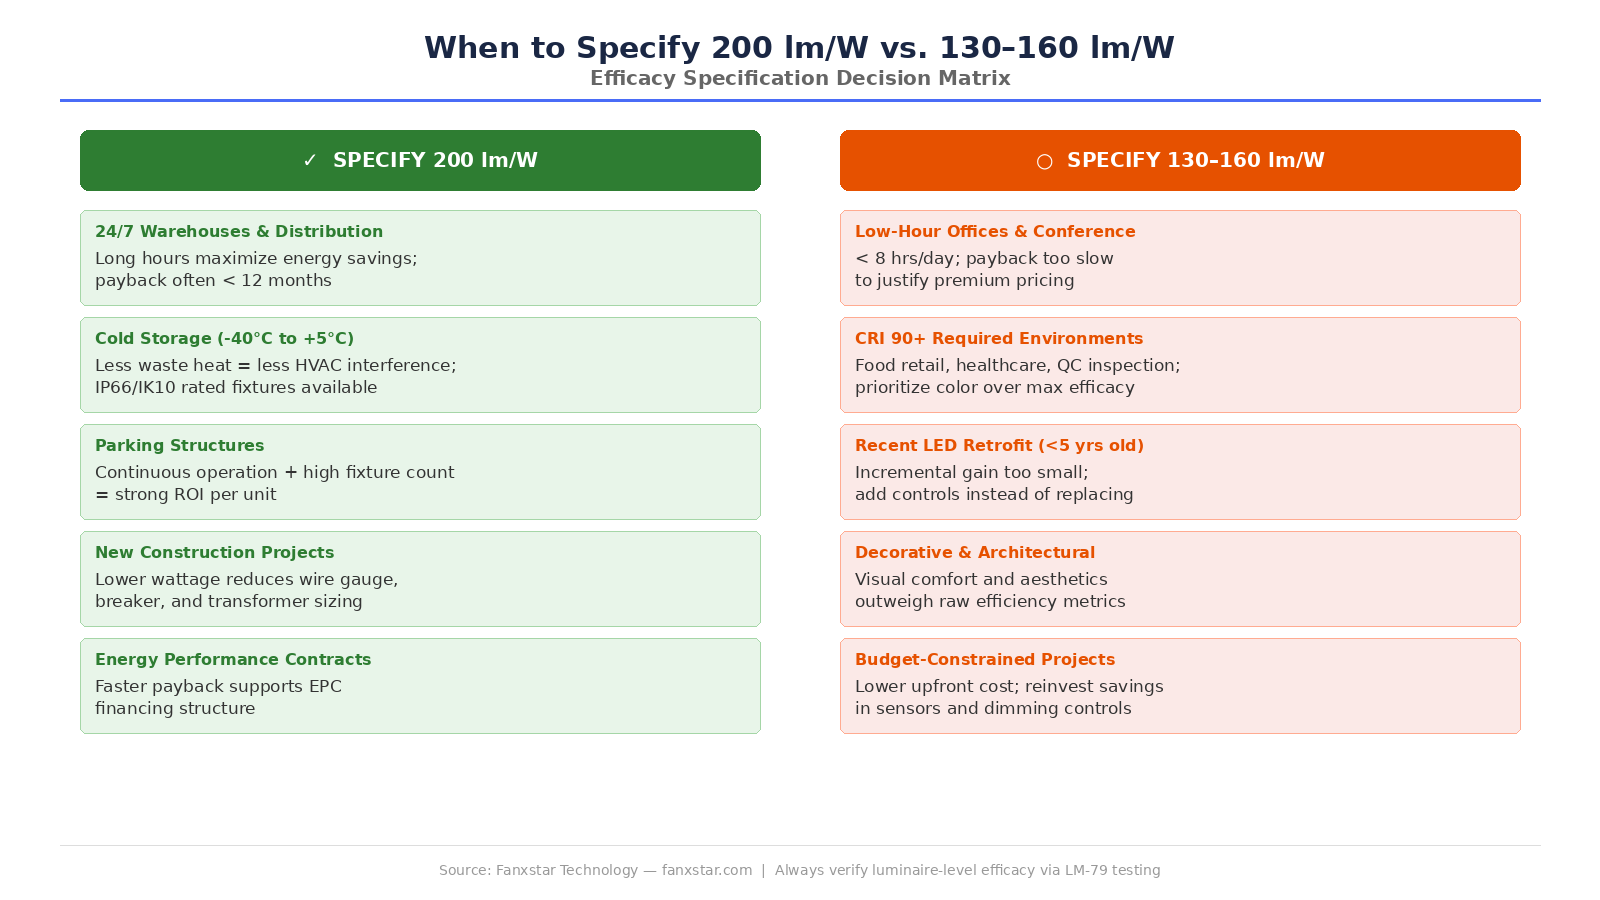
Where 200 lm/W Makes the Strongest Business Case
High-Hour, High-Volume Installations
The math is most compelling in facilities with three characteristics: high fixture counts, long daily operating hours, and rising electricity costs. Distribution centers running 18–24 hours per day, parking structures with continuous lighting requirements, and manufacturing floors with hundreds of luminaires are the environments where every lm/W improvement generates material financial returns.
New Construction vs. Retrofit
In new construction projects, specifying high-efficacy fixtures has an additional benefit that is often overlooked: reduced electrical infrastructure costs. Lower total wattage means smaller wire gauges, fewer circuit breakers, and potentially lower transformer capacity requirements. For a 500-fixture installation, the difference between 23 kW and 15 kW of total lighting load can influence the sizing of the entire electrical distribution system — savings that occur once at construction but persist for the life of the building.
Energy Performance Contracting
High-efficacy LEDs are particularly attractive in Energy Performance Contract (EPC) projects, where the energy savings must be large enough and fast enough to finance the upfront investment. As industry analysis notes, the energy-saving characteristics of high-efficacy luminaires significantly shorten the payback period, helping municipal authorities and project owners allocate saved electricity costs toward upfront capital.
Where 200 lm/W Is Not Worth the Premium
Low-Hour Applications
A conference room used 4 hours per day will take 5–7 years to recoup a 30% price premium through energy savings alone. In these environments, specifying 140–160 lm/W fixtures with superior CRI and glare control is likely a better allocation of budget.
Applications Where CRI Is Non-Negotiable
Quality inspection areas, fresh food retail, and healthcare environments where CRI 90+ is a hard requirement will not benefit from chasing maximum efficacy. Today’s best CRI 90+ fixtures achieve 140–160 lm/W — still excellent efficiency — without the color quality compromises that can occur at the extreme end of the efficacy spectrum.
Retrofit of Recent LED Installations
If your facility was recently upgraded to 120–140 lm/W LED fixtures, the incremental savings from jumping to 200 lm/W are real but smaller, and the payback math becomes sensitive to the cost premium. In most cases, the better investment is adding controls (occupancy sensors, daylight harvesting, DALI dimming) to the existing fixtures rather than replacing them outright.
How to Evaluate High-Efficacy Fixtures for Your Project
The Five-Point Specification Checklist
When evaluating high-efficacy LED fixtures for an industrial or commercial project, request the following from every supplier:
| Document | What It Tells You | Red Flag If Missing |
|---|---|---|
| LM-79 Report | Verified luminaire-level efficacy, total lumens, CCT, CRI, power factor | Efficacy claims cannot be trusted |
| LM-80/TM-21 Report | LED lumen maintenance projection (L70 lifetime) | Lifespan claims are unsubstantiated |
| Dialux/AGI32 Simulation | Predicted illuminance levels and uniformity for your specific space | Supplier has not modeled your application |
| Certification Marks (CE, UL/ETL, ENEC, SAA) | Safety compliance for your target market | Legal liability risk and import complications |
| DLC/Energy Star Listing (if applicable) | Eligibility for utility rebates, validated performance under stress conditions | May disqualify from rebate programs |
Fanxstar provides Dialux simulation and 3D structural rendering as part of the OEM/ODM engineering process — a standard that should be expected from any manufacturer claiming luminaire efficacy above 180 lm/W.
The Bigger Picture: Efficacy as an Industry Trajectory
The push toward higher efficacy is not just a product trend — it is a regulatory trajectory. The U.S. Department of Energy has set a goal to achieve a market standard of 200 lm/W for white LED luminous efficacy, and projects that energy savings from LED lighting could top 569 TWh annually by 2035 if performance targets are met — equivalent to the annual output of more than 92 large power plants. In the EU, the Energy Efficiency Index (EEI) regulations for lighting products are tightening continuously, making higher-efficacy fixtures not just an ROI proposition but a compliance pathway.
For procurement teams evaluating lighting investments today, the direction is clear: efficacy floors are rising across all markets, and fixtures purchased at 130 lm/W today may face premature obsolescence in regulatory environments that demand higher performance within the next 5–7 years.
Frequently Asked Questions
Is 200 lm/W achievable at the luminaire level, or only at the chip level?
Both, though the figures differ. Modern LED chips from manufacturers like Philips Lumileds, Nichia, and Samsung can exceed 220 lm/W under optimal lab conditions. At the complete luminaire level — accounting for driver, optical, and thermal losses — fixtures achieving 190–210 lm/W are commercially available today, primarily in high-bay and industrial form factors with 5000K CCT and CRI 80. The key is to verify luminaire-level performance through LM-79 testing rather than relying on chip-level specifications.
Does high luminous efficacy mean the fixture will last longer?
Indirectly, yes. Higher efficacy means less waste heat at the LED junction for a given light output, which reduces thermal stress — the primary driver of LED lumen depreciation. A fixture producing 30,000 lumens at 150W (200 lm/W) generates significantly less heat than one producing the same lumens at 231W (130 lm/W). This lower thermal load, combined with proper heatsink design, supports longer L70 lifetimes. However, lifespan ultimately depends on the complete thermal management system, driver quality, and operating environment — not efficacy alone.
How much more do 200 lm/W fixtures cost compared to standard options?
Pricing varies by product category and manufacturer, but typical premiums range from 20–40% over comparable 130 lm/W fixtures. The gap is narrowing as high-efficacy LED chips become more cost-effective to produce. For high-hour industrial applications, the energy savings typically recover this premium within 12–24 months. For a detailed cost analysis tailored to your project specifications, including fixture count, operating hours, and local electricity rates, contact our engineering team for a free consultation.
Choosing the right LED fixture is about more than a single number on a spec sheet. Luminous efficacy is a powerful lever for reducing operational costs — but it must be balanced against color quality, visual comfort, thermal performance, and total system reliability. For facility managers and procurement engineers working in demanding industrial environments, the question is not whether high efficacy matters, but how to deploy it where it delivers the highest return. Tell us about your project, and Fanxstar’s engineering team will provide a technical consultation with Dialux modeling and ROI analysis tailored to your facility.